
The average order is a fragile buying assumption
A quote can look attractive because it fits the orders you shipped last month. That does not establish that it fits the orders your sales plan is about to create. A promotion, assortment change or new channel may change the work inside each order without changing the total order count.
Before selecting a 3PL, ask how the shortlist changes when your order mix changes. Start with two meaningful groups, not a complicated forecast: routine orders and orders with an additional documented handling requirement. Use actual quote definitions for those groups. An order with three units is not necessarily operationally equivalent to a personalized gift set with three units.
An illustrative comparison where the cheaper option changes
The following rates are invented for analysis. They represent a narrowly defined handling charge only; they are not quotes, market averages or complete fulfillment costs. Assume both fictional providers can meet the same required service specification.
| Input | Provider A | Provider B |
|---|---|---|
| Routine-order handling | $2 | $3 |
| Complex-order handling | $6 | $4 |
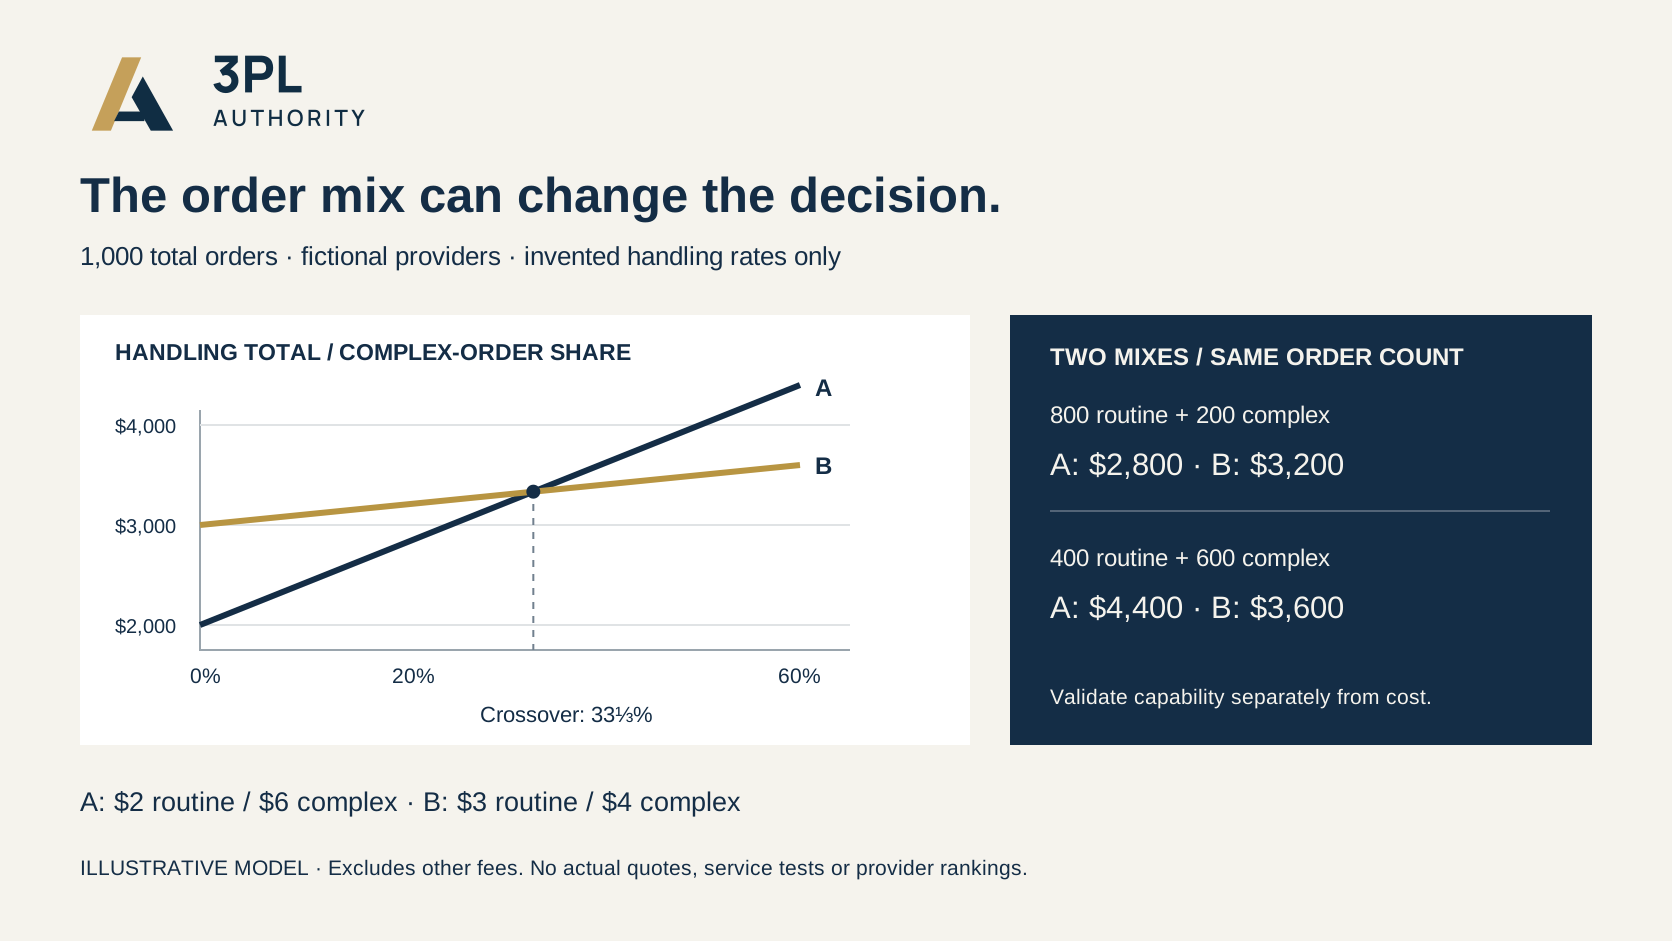
| 800 routine + 200 complex orders | $2,800 | $3,200 |
| 400 routine + 600 complex orders | $4,400 | $3,600 |
At the first mix, A costs $400 less. At the second, B costs $800 less. Total demand remains 1,000 orders. The choice changes because the work changes.
Let c be the number of complex orders in that fixed total. A costs $2,000 + $4c; B costs $3,000 + $1c. They cross at 333⅓ complex orders, or one-third of demand. With whole orders, A remains cheaper at 333 complex orders and B becomes cheaper at 334. That boundary is a decision aid, not a forecast.
Turn the crossover into a commercial question
Ask the sales team what would cause the complex share to rise. A planned bundle launch is a different kind of evidence from an aspiration to sell more premium products. Record the expected mix, an adverse mix and the business event behind each. Keep the same total volume initially so that mix effects remain visible.
Then add separate rows for storage, account fees, receiving, packaging and transportation. The SBA's cost guidance distinguishes fixed, variable and mixed costs. That distinction is useful here: a common fixed fee does not change this example's crossover, while different fixed fees or other mix-sensitive charges can. Our two-cohort calculation is an original illustrative model, not an SBA comparison method.
Do not add a second handling fee if the quoted complex rate already includes routine handling. Have each provider confirm the same worked invoice, including how an order enters a cohort and which charges remain additional.
Keep cost sensitivity separate from capability
A provider's low complex-order price means little if the required process is excluded or unproven. Ask for the packing instructions, exception owner and a proposed validation plan for the complex cohort. This article does not establish that any real provider can execute either workflow.
Use a short decision record: current mix; plausible changed mix; cost difference under each; capability evidence still missing; and the trigger for revisiting the selection. If one provider wins only under a narrow assumption, make that dependency visible before committing inventory.
What this exercise does and does not tell you
We calculated four totals and one crossover using two fictional providers. We did not measure service, capacity, damage, delivery or actual buyer demand. The useful conclusion is that a shortlist should survive changes in the work it must perform. Replace every assumed rate and cohort count with your own evidence before relying on the result.
Related reading
Sources
- Primary source 1 — accessed 2026-10-27.